INTRODUCTION
As fiduciaries, asset owners have an imperative obligation to evaluate the performance of investment portfolios, upon which they have oversight responsibilities. Further, all efforts to conduct a comprehensive evaluation should certainly include relative comparisons (i.e., performance relative to a benchmark, to peers, etc.). Peer review is an effective tool because absolute results only tell one part of the story and the fiduciary obligation should be a holistic one. A broadly familiar concept, peer review is commonly practiced across various corporate industries, science, and academia. Its most prevalent use may be in everyday conversations, “Did my portfolio perform better than my neighbor’s?” That it is an easily understood tool is an added benefit within investment committees whose members may not be financial professionals, fluent in the industry performance-speak of compounded returns and standard deviations.
The problem with incorporating peer groups, or universe comparisons, as part of a performance review is that when constructing a data set, “the devil is in the details.” There is no industry standard or commonly adopted approach that is required to be followed when aggregating groups of investment managers undertaking a similar investment mandate. As such, data integrity issues are persistent. The comfort of asset owners, or investment committee members, with the concept of peer comparisons often results in an over-reliance on what may be an inappropriate comparative standard. Importantly, decisions are made using backward-looking data, which, as most investment disclosures highlight, likely have no bearing on future results. And even more troubling is that resulting decisions are often made at the most inopportune time. The basic human tendency to compare your results to those of others around you, without a full knowledge of how the universe is defined, can lead to making misinformed or ill-timed decisions within a fiduciary context.
UNIVERSE PROBLEMS
There has been no clearer example of this phenomena than the steady and increasingly louder drumbeat in recent years about how passive investment strategies (i.e., index funds) have outperformed active equity management. Barely a day goes by without another article in the mainstream investment media touting that performance advantage. Interestingly, the bulk of those articles are referencing the same data set, the SPIVA® U.S. Scorecard, distributed by S&P Dow Jones Indices LLC (a division of S&P Global), provider of the most ubiquitous equity index, the S&P 500. The published data is based on a comparison of the S&P 500 Index (a proxy for the broad U.S. equity market, focused on larger companies) to a universe, or peer group, of active equity investment managers that operate within a similarly broad market investment mandate.
The pervasiveness that this message has achieved in recent years has resulted in meaningful changes across asset classes. Specifically, the industry has experienced a widely reported flow of funds out of active management and into passively-managed index funds. This movement can be largely attributed to the reaction of asset owners to the information that passive indexes have outperformed active strategies. Importantly, this behavior is common throughout the investment industry, whereby asset owners tend to make emotional decisions based on a single measure (i.e., peer group rankings).
Since many forms of comparative performance data appear throughout daily life, at times it can lead to overly simplistic assumptions by non-experts and experts alike, without consideration for the underlying details or timing implications. As outlined above, the highly publicized results of the SPIVA® analysis have prompted countless investors to transition out of actively managed investments into the less expensive and obviously superior passive strategies.
In the first half of 2017 alone, flows out of active funds and into passive funds reached nearly half a billion dollars which follows a trajectory that has been occurring over the last several years. Some of this shift can certainly be attributed to manager attrition, a greater focus on costs, etc. However, the impact of this broadly disseminated SPIVA® data cannot be ignored.
Characteristically, a high-level summary of the results are included in most articles; but unless efforts are made to read the fine print in the study, little thought may be given to how that performance was measured. Would the perception of outperformance be as great if S&P constructed these peer groups using a different methodology or data provider? Most investment professionals or consultants utilize a third-party data source to construct peer universes for investment reporting purposes. What if those reported results appear to be different from one data provider to the next? As a simplistic comparison, Table 1 outlines the magnitude of outperformance per the SPIVA® analysis (as of YE 2016) versus a similarly-defined universe from another data provider.
In summary, SPIVA® noted that over the trailing 3-year period, the S&P 500 Index outperformed nearly 93% of peers. However, the alternative data provider shows that the index outperformed only 69% of peers, and so on. Not surprisingly, different construction methodologies can paint different performance pictures, upon which meaningful decisions are made and often at the worst time (i.e., sell low, buy high). And, as mentioned previously, investment committee members are not keen on the prospect of having active managers that lag an index or those that have fallen into the bottom half of their peer group. Competition plays a powerful role in society and no Fiduciary wants to deliver less-than-optimal results to their constituents, especially when everyone is reading the same headlines.

Conversely, there is a widely recognized standard for defining investment benchmarks (see call-out box). The CFA Institute similarly provides Global Investment Performance Standards (“GIPS”), clearly outlining the methodology for investment return reporting, whereby investors can make “apples to apples” comparisons. The application of these standards has been widely adopted throughout the industry. What’s troubling is that there is no such method of standardization when constructing investment universes or peer comparisons. There are myriad ways to define a group of similarly managed investments, and moreover, there are numerous ways to view the data. As an example, when comparing returns of an index to a universe, as above, should calendar year returns be included or returns over rolling periods? Or, as the SPIVA® analysis includes, historical trailing return periods? Each method can meaningfully shift the ranks of performance within a group. Another consideration that might impact results is whether to assess the group on a gross or net of fees basis? In some instances, the differences can be material. Other questions for consideration: Are there a sufficient number of funds for a meaningful comparison? Is the universe representative (i.e., stylistically)? Is the group adjusted for survivorship bias (i.e., have failing funds dropped out of the group)? If measuring returns over a 10-year period, do newer funds get excluded because they lack a full track record? Is a peer, with a lengthy track-record but minimal assets, treated the same as a similar manager that has built a significant asset base? These are all factors that can impact the results of a comparative analysis and they are all different ways that a peer group can be customized for performance reviews. One of the primary properties of an appropriate benchmark is that it should be investable. Are the investments within peer groups investable? All of these nuances suggest that multiple methods of comparison should be employed.
Table 2 below highlights average returns of various third-party investment universe providers, over annualized trailing time periods for Large Cap Core Equity strategies.
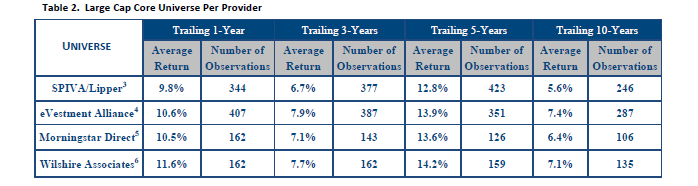
These data providers are heavily relied upon by institutional investors, investment consultants, etc., for performance reporting needs. However, this group of broadly-defined large-cap equity managers offers a good example of the dispersion that can occur in universe construction. Each universe below is compiled (or customized) differently with a varied number of constituents included within. While the breadth of average returns is fairly narrow across the various providers, the meaningful variation in the number of observations (or constituents) can have a potentially material impact on manager placement within such universe. These differences could translate to a simplistic below-median or above-median assessment, upon which investment decisions are often made.
BACKWARD LOOKING IMPLICATIONS
The combination of reactionary investment decisions (owing to below-median peer rankings) and the use of backward-looking performance results is even more troublesome. And the practice feeds into one of the most common blunders made by investors, poorly-timed exits. Numerous studies have revealed the capital destruction that occurs when asset owners fire investment managers following a period of underperformance, only for that manager to rebound with strong returns. Morningstar has quantified an annual loss of 2.5% to poor market-timing decisions by asset owners, not to mention the transaction costs that often occur when churning through managers.
The most common timeframe under which these destructive decisions occur are over trailing one-, two- and three-year periods. Periods of strong performance can result in portfolios that become overvalued and investors would be ultimately better off taking profits from those managers. However, as has been widely documented, investors tend to chase performance by selling the underperforming manager and buying a recent outperformer (i.e., an accordingly more expensive portfolio) with a limited runway to maintain its performance advantage. Given the challenging environment for active managers in recent years, it is not surprising that peer group rankings have declined for many previously successful managers. This can be especially impactful depending on the universe that is being used for comparison, as outlined above. It is not unusual for an investor to fire a manager for poor relative results and move to an area of the market that has generated recent outperformance, without giving proper consideration for what lies ahead. This has become recently evident as asset owners have witnessed the extended bull-market of the past several years. An argument can be made that shifting exposure to passive strategies (which own ‘the market’), per the recent outperformance, might leave portfolios fully-exposed to a market correction. In contrast, active managers have more flexibility to diversify away from the market-beta, via off-benchmark holdings or increasing cash positions, in order to cushion the impact from a sell-off.
“From financial history and from my own experience, I long ago concluded that regression to the mean is the most powerful law in
financial physics: Periods of above-average performance are inevitably followed by below-average returns,
and bad times inevitably set the stage for surprisingly good performance.”
– Jason Zweig, Wall Street Journal
CONCLUSION
As noted previously, peer group comparisons are commonly utilized, primarily because it is a relatively simple way to make an assessment, not unlike evaluations relative to a benchmark. Often times, an organization’s Investment Policy Statement even mandates the use of peer group rankings for performance reviews. However, investment strategy universes (unlike benchmarks) lack an industry standard or defined construction methodology. Comparing well-established strategies to those with little or no assets, no meaningful track record, and disparate investment mandates leads to inaccurate results. Further, the implication of reactionary decisions, based on peer group review, can be destructive to investment portfolios.
Customized universes that utilize third-party investment data are often a mainstay of investment reporting firms and transparency should be paramount when dealing with any investment data. Importance should also be placed on documenting and educating clients on reporting methodology, universe construction methodology, and consistency of reporting across asset classes. Despite the challenges mentioned above, peer universes can certainly provide some utility when evaluating investment managers, but they should be viewed as “one tool in the toolkit,” rather than a primary decision-making tool. Peer review is most effective when used in conjunction with additional risk-adjusted performance measures (i.e., Sharpe Ratio, Information Ratio, etc.) which are valuable supplements to any analysis. However, these statistics are also backward-looking and consideration must be given to expected future returns and reversion to the mean. A focus from asset owners on establishing a long-term time horizon can mitigate many of these issues. In addition to a contextual view of market performance, reviewing an investment’s correlation to a stated benchmark and other comparative portfolio measures, such as active share, etc., can be useful to gain the full picture of a manager’s results relative to an index or a group of like-minded peers. While peer group/universe rankings can be demonstrative, it is often very difficult to establish meaningful comparisons and, therefore, the focus should be broadened to incorporate a comprehensive review of multiple data points.
References:
Soe, CFA, Aye M. and Ryan Poirier, RRM. 2016. “SPIVA® U.S. Scorecard.” S&P Dow Jones Indices.
Stein, Charles. 2017. “Active vs. Passive Investing.” Bloomberg.com.
Strauts, Timothy. 2014. “Bad Timing Costs Investors 2.5% a Year.” Morningstar.com.
Arnott, Rob, Vitali Kalesnik, and Lilian Wu. 2017. “The Folly of Hiring Winners and Firing Losers.” Research Affiliates.
Goyal, Amit, and Sunil Wahal. 2008. “The Selection and Termination of Investment Management Firms by Plan Sponsors.” Journal of Finance, vol. 63, no. 4 (August): 1805-1847.
Bailey, CFA, Jeffrey V., Jesse L. Phillips, CFA, and Thomas M. Richards, CFA. 2011. “A Primer for Investment Trustees.” Research Foundation of CFA Institute.
Foresti, Steven J., and Chris Tessman. 2017. “ 2016 Active Management Review.” Wilshire Associates Incorporated.
End Notes:
1. Data provided in the SPIVA® US Scorecard, year-end 2016; Large Cap Core Universe.
2. eVestment Alliance; Large Cap Core Equity Universe vs. the S&P 500 Index; as of 12/31/2016. Strategies included are presented primarily gross of fees, but not exclusively. The information includes mutual funds and separate account vehicles.
3. The SPIVA® universe reviewed is the Large Cap Core universe. The constituents presented in the dataset includes the number of mutual funds at the start of the period. SPIVA® adjusts the data for survivorship bias. Information presented is net of fees. Average returns are equal-weighted.
4. The eVestment Alliance data set represents the Large Cap Core universe. Strategies included are presented primarily gross of fees, but not exclusively. The information includes mutual funds and separate account vehicles. Return calculations through 12/2016.
5. The Morningstar Direct data includes mutual funds within the Large Cap Core category. The information is limited to Institutional share classes. All of the performance is presented net of fees. The category includes both active and passive strategies, and only includes surviving investments. Return calculations through 12/2016.
6. The Wilshire Associates data set represents the Wilshire Defined U.S. Large Cap Core universe, as calculated from average excess return over the benchmark the Wilshire vs Large Cap Core Index. Performance is represented gross of fees. This paper had no transparency into the underlying strategies included from the Wilshire Database.
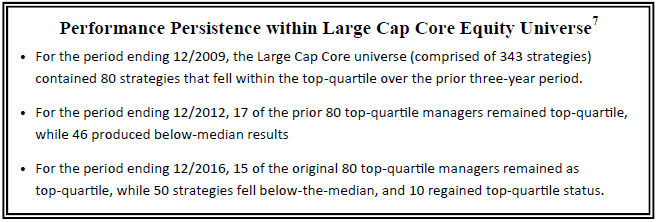
7. Dataset obtained from the eVestment Alliance includes three-year rolling period returns for the Large Cap Core Equity Universe, through 12/31/2016. Of the 468 total strategies listed within the universe, only 343 reported returns for the period ending 12/31/2009.